AUTHORS: Thorfinn Stainforth, Sarah Pepinster
In the last 30 years, the amounts of CO2 emissions have increased at a rate faster than ever before in history. IEEP has calculated that they would need to be reduced twice as fast by 2030 in order to stay well below a 2°C increase.
On average, global CO2 emissions should be reduced by 3.4% every year until 2030 compared to 2019 levels in order to remain consistent with the Paris Agreement objective to keep global heating well below 2°C. That is over twice the rate at which emissions have been increasing for the past 30 years.
Global ambitions
At next month’s COP27 in Sharm El Sheikh, countries will be expected to amp up their plans to reduce global emissions in the coming years if we are to limit the impact of climate change upon our ecosystems and the way we live in our societies. The last two summers have given us a glimpse of the extent of these consequences, which “are appearing much faster, are more disruptive and more widespread than we expected 20 years ago”.
In the most recent IPCC report, modelling “consistent with the continuation of policies implemented by the end of 2020” shows that greenhouse gas (GHG) emissions will continue to rise, leading to a global heating of 3.2°C by 2100.
To stay below a 2°C increase, and thus remain consistent with the primary objective of the 2015 Paris Agreement, global CO2 emissions need to be reduced by 27% by 20301. This translates to an average 3.4% reduction from 2019 levels annually, assuming a linear rate of decrease from 2022. The eventual rate will be non-linear, and issues such as frontloading and backloading need to be considered2. To remain below 1.5°C, lower climate risks further, and potentially avoid some climate tipping points, even more drastic cuts of 48% would be needed.
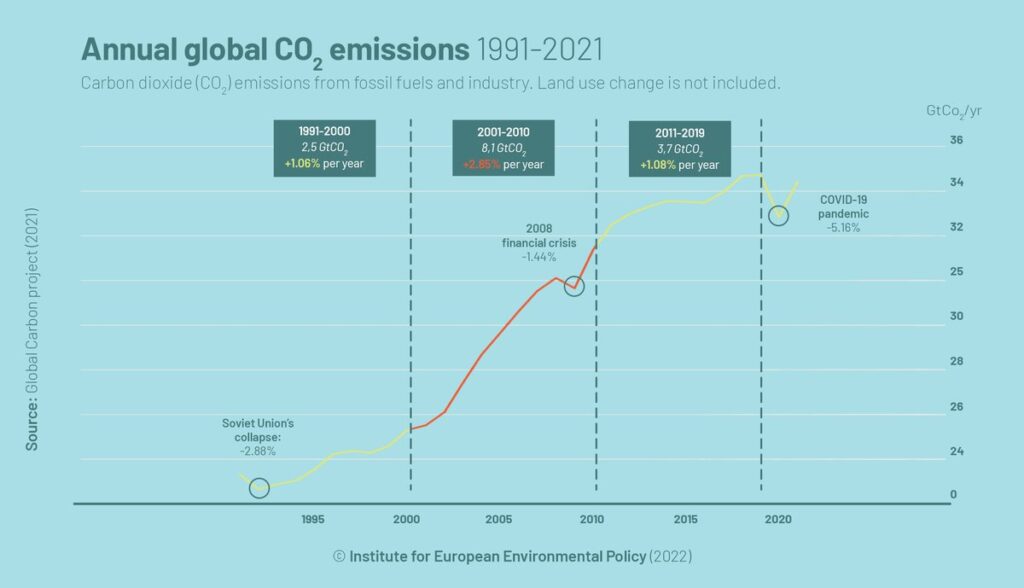
Looking at the average annual growth rate for the period 1990-2019, this means we need to be drawing down emissions more than twice as fast as they have increased over the last 30 years. Indeed, despite three significant declines caused by the collapse of the Soviet Union in the early 1990s, the 2008 financial crisis and the COVID-19 pandemic in 2020, CO2 emissions have continued to rise at an average of 1.7% annually since 1990. However, it is worth noting a slowing in the rate of growth in emissions in recent years, from a peak 3% average growth between 2001 and 2010, to about 1% between 2011 and 2019.
Responsibility
This 3.4% reduction rate pertains to global emissions; the EU and other developed countries will need to cut their emissions even faster to account for their historic responsibility. According to our calculations, this translates to roughly a 70% cut from 1990 levels by 2030, while the EU’s current goal is at least 55%.
Between 1990 and the signing of the Paris Agreement in 2015, the consumption of the world’s richest 1% drove twice the carbon emissions of the poorest half of the global population combined, and the share of the richest 1% continues to grow. In an era of accelerated global heating, around a third of the global carbon budget for limiting global heating to 1.5°C was squandered just to expand the consumption of the richest 10% of the world population.
On a national basis, the rise in emissions since 1990 is driven to a large extent, though not only, by rapidly increasing emissions in China, which more than offset very moderate reductions or stabilisation in most developed countries. Per capita emissions in China are now equivalent or above many European countries. China has promised to peak emissions before 2030; the exact timing of that turning point will have a huge influence on the global peak.
30 years of stalling
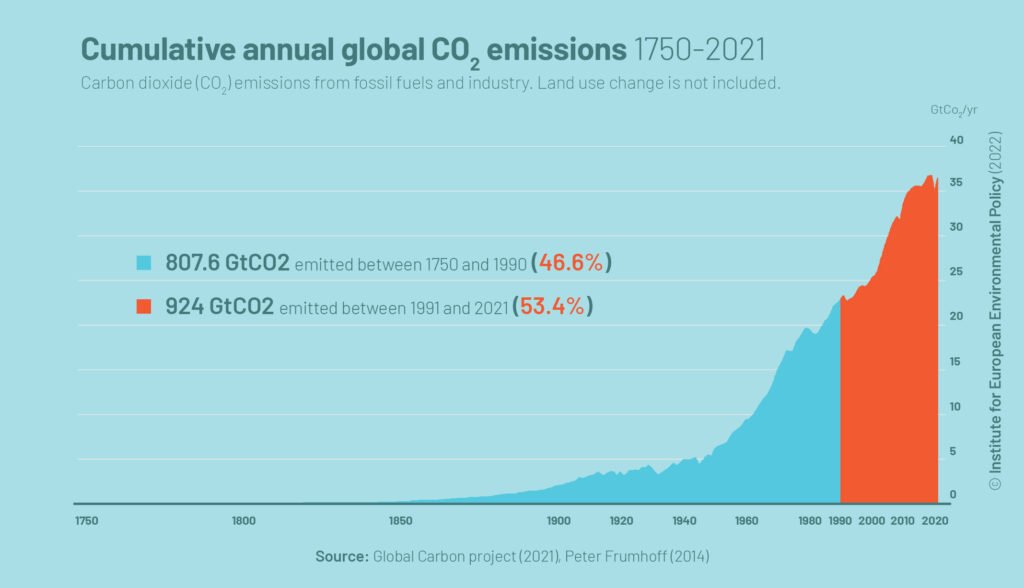
IEEP has also updated a graph initially published in 2020 that shows that over half of all cumulative global CO2 emissions have taken place since 1990, the year the first IPCC Assessment Report was published. 1990 is often seen as the year after which policymakers can reasonably be considered to be aware of the dangers of human-induced climate change, and thus responsible for containing it, especially in countries responsible for the majority of emissions produced until then.
The graph, now adapted to include 2020 and 2021 emissions, shows that not only did policymakers not succeed in reducing emissions since then, but emissions have grown substantially. We have now emitted more since 1990 as in all of history before then.
Decisions to be taken at COP27 will be crucial to whether we will be able to reverse the growth in time. If climate pledges stay as they stand, UNEP’s 2021 Emissions Gap Report shows that we are on track for a global temperature rise of 2.7°C by the end of the century.
_______
Source: Based on figures from Carbon Budget Project presented by Our World in Data, “Cumulative CO2 Emissions, 1750-2020. https://ourworldindata.org/grapher/cumulative-co2-emissions-region?stackMode=absolute. [Accessed 25 September 2022]
1 IPCC, 2022: Summary for Policymakers. In: Climate Change 2022: Mitigation of Climate Change. Contribution of Working Group III to the Sixth Assessment Report of the Intergovernmental Panel on Climate Change [P.R. Shukla, J. Skea, R. Slade, A. Al Khourdajie, R. van Diemen, D. McCollum, M. Pathak, S. Some, P. Vyas, R. Fradera, M. Belkacemi, A. Hasija, G. Lisboa, S. Luz, J. Malley, (eds.)]. Cambridge University Press, Cambridge, UK and New York, NY, USA. doi: 10.1017/9781009157926.001.
2 Otto, Ilona M., et al. “Social Tipping Dynamics for Stabilizing Earth’s Climate by 2050.” Proceedings of the National Academy of Sciences, vol. 117, no. 5, Proceedings of the National Academy of Sciences, Jan. 2020, pp. 2354–65. Crossref, https://doi.org/10.1073/pnas.1900577117